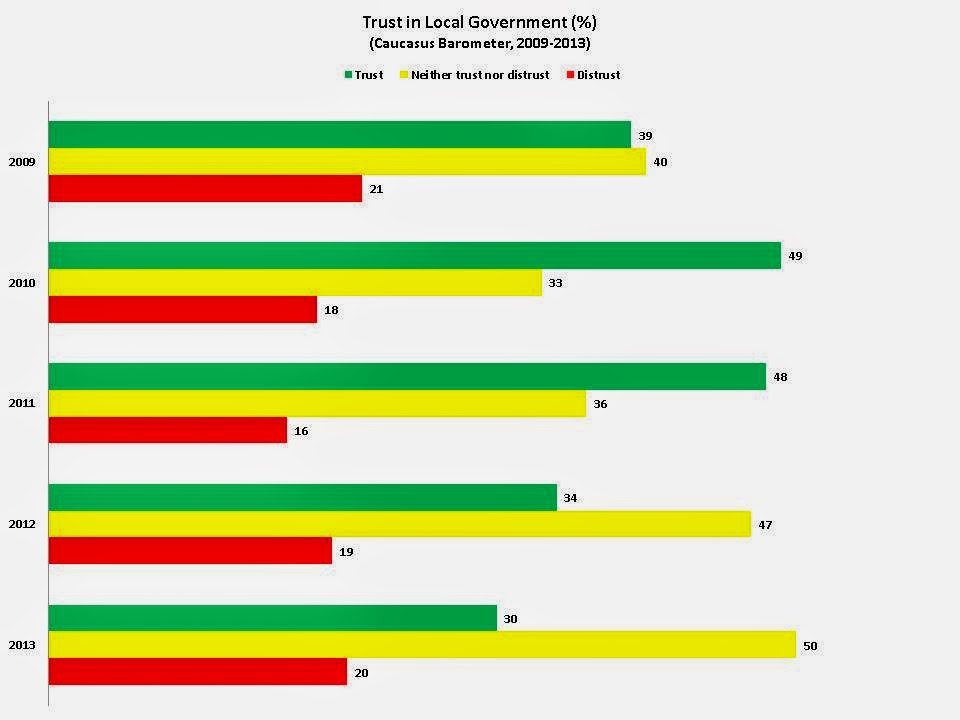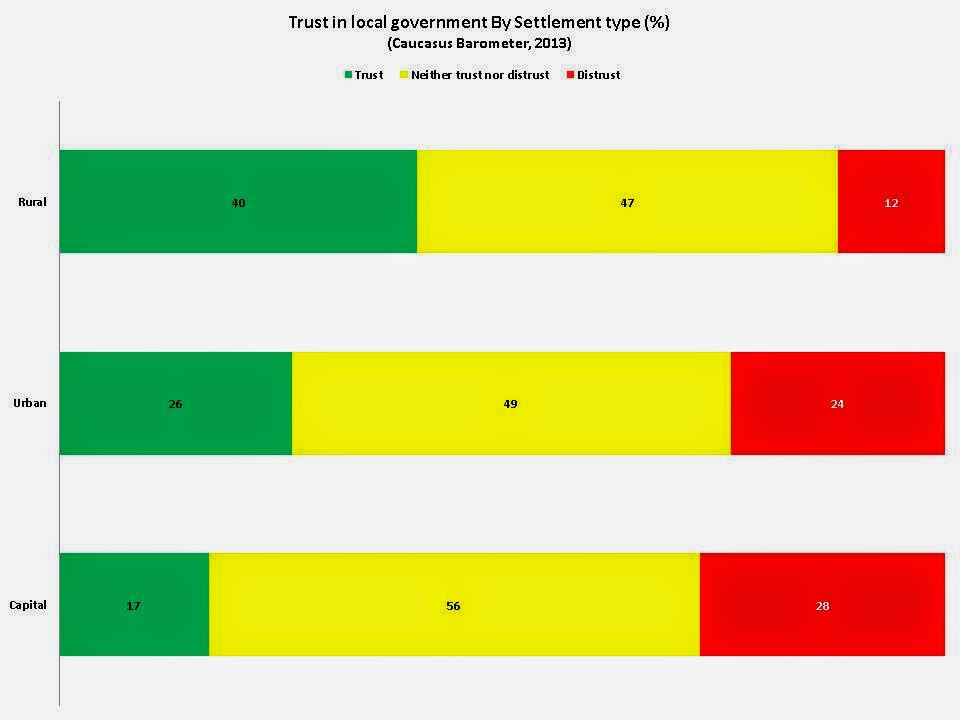
Note: In this graph and the graph below, a five-point scale has been recoded to a three-point scale with responses ‘1’ and ‘2’ coded as distrust, responses ‘3’ being coded as neither trust nor distrust, and responses ‘4’ and ‘5’ coded as trust. During the CB, respondents were read out a list of institutions and asked to “assess [their] level of trust toward each [institution] on a 5-point scale, where ‘1’ means ‘Fully distrust’, and ‘5’ means ‘Fully trust.”
Interestingly, trust in local government is much lower in Tbilisi and urban areas compared to rural areas. In rural areas, Georgians trust their local government (40%) more than twice as much as in Tbilisi (17%). Residents of the capital are more than twice as likely to express distrust in the local government with 28% reporting distrust in Tbilisi versus 12% in rural areas. Urban areas, not including Tbilisi, are more likely to express trust than Tbilisians, but interestingly express a similar level of distrust in local government as capital residents.
This blog post has reviewed levels of trust in local government over time. It shows that Georgians seem to have become ambivalent with regard to their view of local government. The blog further demonstrates that levels of trust in local government are higher in rural areas than in urban areas. If you would like to further explore issues of trust in Georgia and the South Caucasus more generally, view the blog post here, or explore the data further using our Online Data Analysis tool.


