According to data from CB 2013, 40% of Georgians are either employees (25%) or self-employed (14%). In this survey, those who do not have a job are grouped into the following categories: unemployed (25%), retired (17%), housewives (12%), students (4%) or disabled (2%). One can reasonably expect that people who work are more likely to have less time to participate in different kinds of activities compared to the unemployed. However, CRRC Caucasus Barometer data demonstrates that people who work tend to get involved in different kinds of activities more frequently than those who do not work.
Working people are more likely than the unemployed to participate in activities which involve socializing, meeting new people and helping others. Twenty five percent of those who have a job said that they have volunteered without compensation and 23% have attended a public meeting during the last six months, while only 17% and 13%, respectively, of the unemployed did the same. Also, when asked whether they have done any unpaid or paid work for their family’s business for at least one hour within the past week, more of those who work answered positively compared to the unemployed.
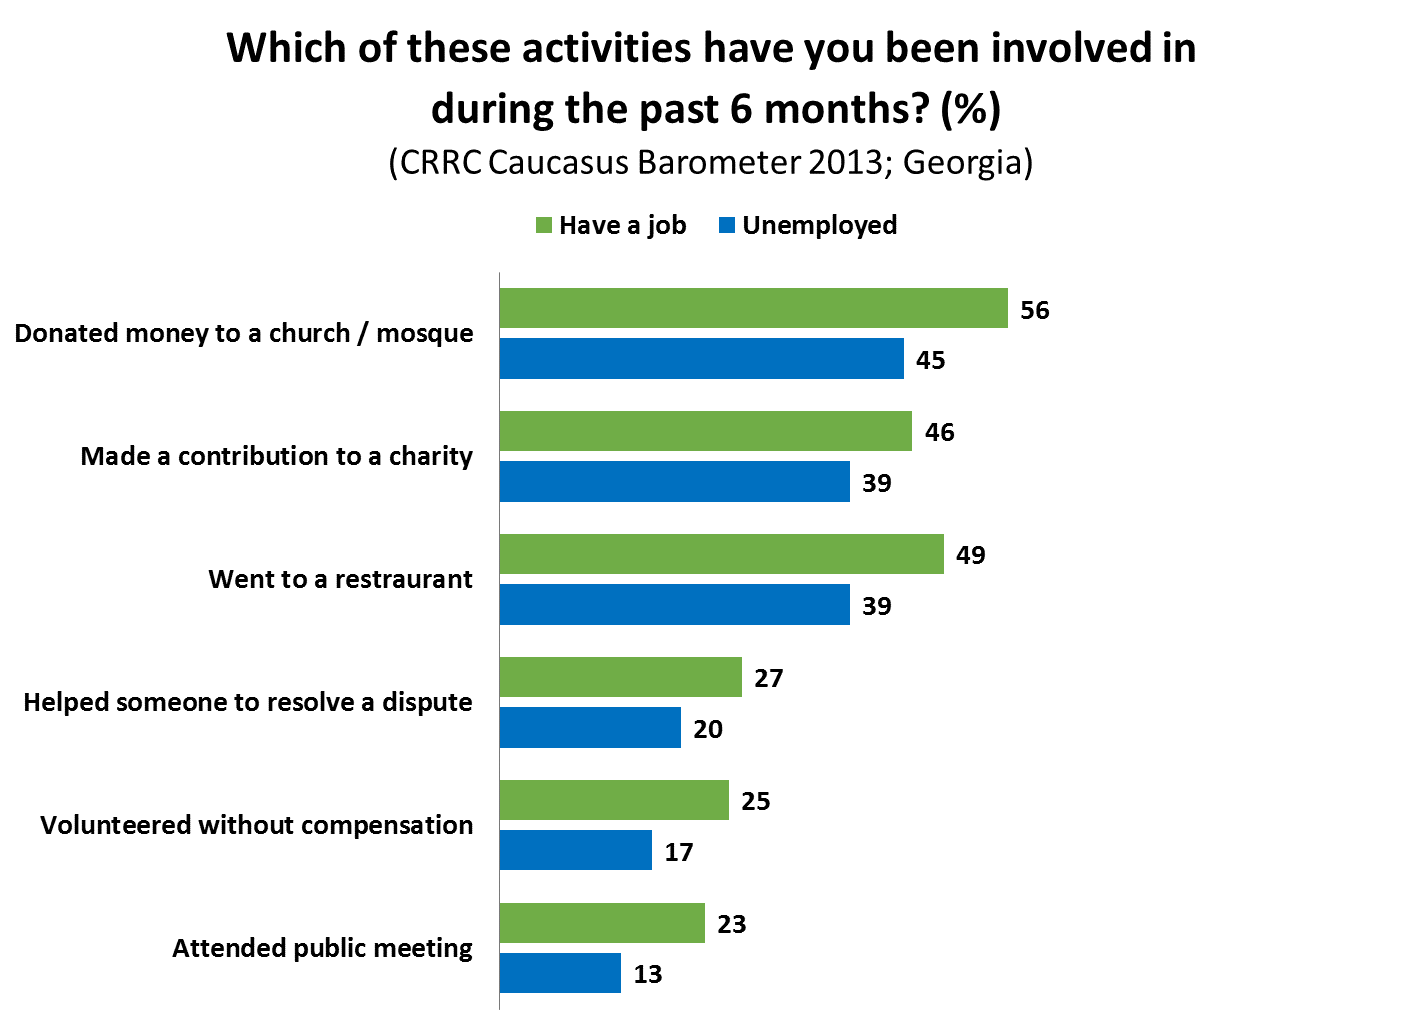
Note: The graph above only gives the percentage of “Yes” responses. It does not give percentages of “No”, “Don’t Know” and “Refuse to Answer”. The chart gives only the answers of respondents who have a job or are unemployed. Housewives, students, retired people, the disabled and others are excluded.Moreover, when it comes to political participation, working people report higher rates of involvement. Around 90% of both those who have a job and those who do not say they would participate in presidential elections if they were held next Sunday, but when it comes to reality, 90% of working people reported voting in the 2012 parliamentary elections compared to 81% of the unemployed. Here, it is important to note that according to the Central Election Commission of Georgia, the turnout in this election was only 59.75%. The number of respondents who report that they have or will vote is usually higher than the actual turnout. There are many reasons for this discrepancy; however, this blog does not seek to analyze these reasons.
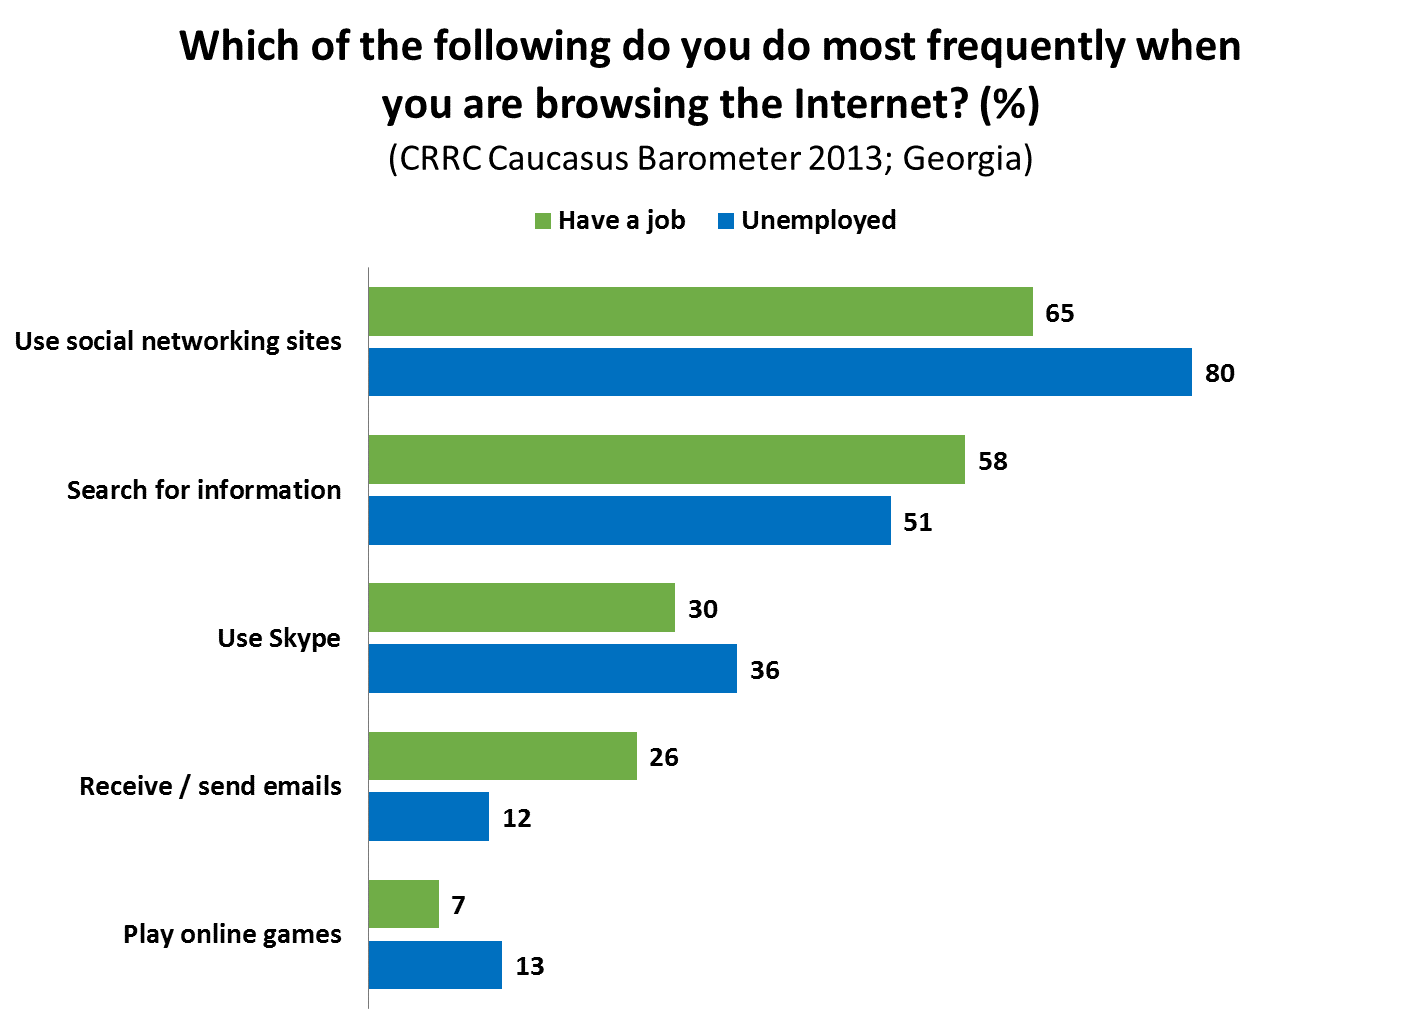
Those with jobs and without are similar in their frequency of using the internet but differ from each other in respect to their behavior while browsing the internet. As CB 2013 shows, 36% of those who work and 31% of the unemployed say they use the internet every day. The most frequent activities when browsing the internet are similar in both groups, but the frequencies are different between groups. Most of the time, people use the internet to visit social networking sites or to search for information, though those who have a job are less likely to use the internet for social networking sites and are more likely to search for information. They are also more likely to send and receive email, which may be related to their work.
In your opinion, why are the unemployed less involved in the social activities discussed in this blog? What is the reason for unemployed people not participating in many social activities? Is it only related to economic factors or are there other factors that could explain these findings?
Share your ideas on the CRRC’s Facebook page.
