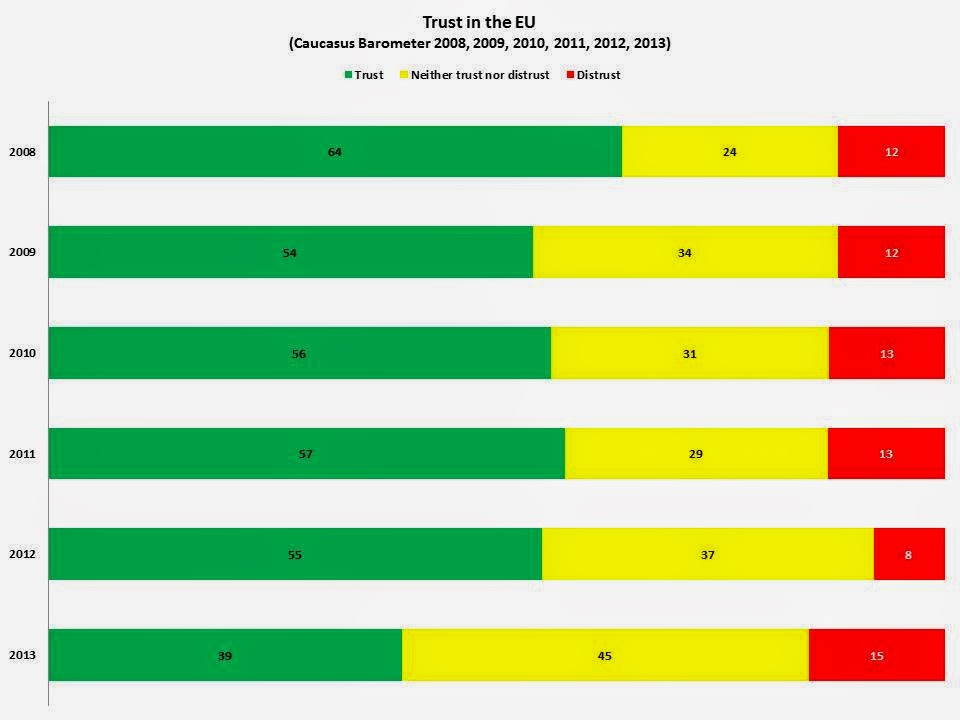
The graph below shows trust in the EU over time in Georgia. In 2008 trust in the EU was at 64%, followed by a slight decrease in trust which remained stable from 2009 to 2012. Interestingly, in 2013, a decrease in the level of trust occurred with trust responses dropping 16 percentage points, distrust increasing by seven, and neither trust nor distrust increasing by eight percentage points. Thus, a more ambivalent attitude towards the EU appears to have emerged in 2012 and 2013.
Note: Respondents were asked “Please tell me how much do you trust or distrust the European Union?” In the graph above, ‘fully trust’ and ‘somewhat trust’ are combined to form “Trust” and ‘somewhat distrust’ and ‘fully distrust’ are combined into “Distrust”.
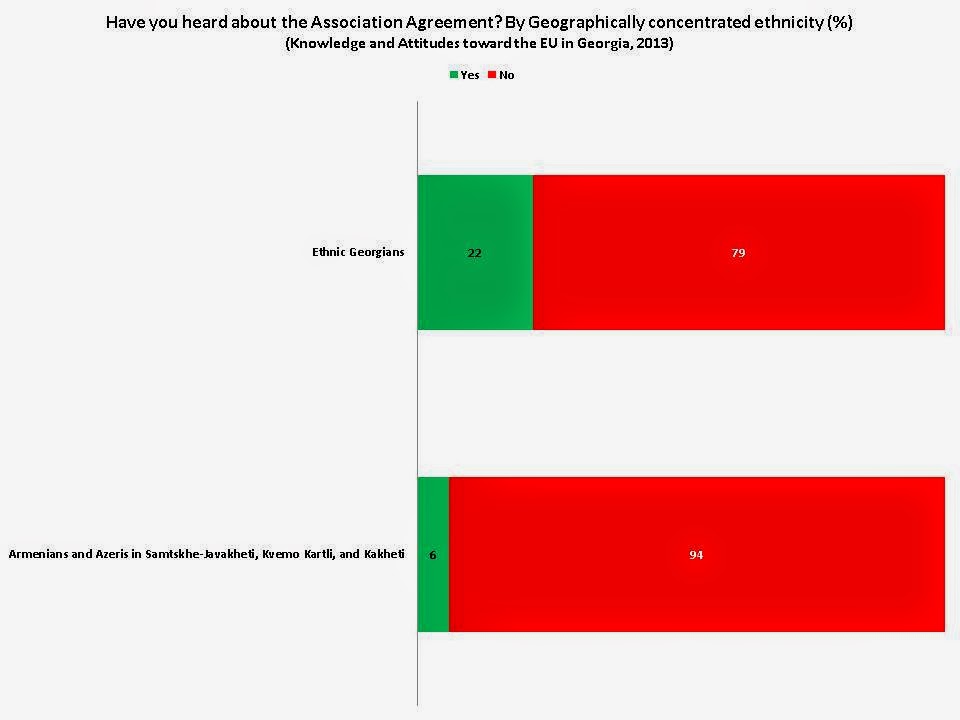
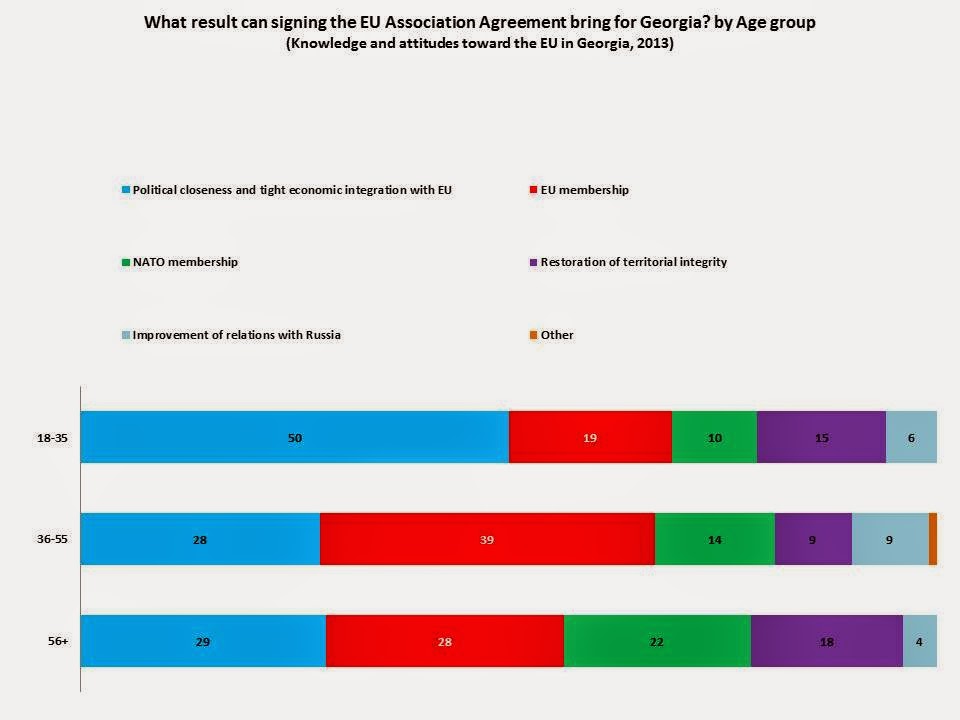
This post has shown that awareness of the Association Agreement in Georgia is lower among ethnic minorities than ethnic Georgians in Georgia, likely due to lack of access to Georgian-language media and knowledge of Georgian. It has further discussed expectations among different age groups for the agreement, showing that young adults in Georgia expect closer ties from the agreement, while 36-55 year olds are more likely to believe that the agreement will lead to EU membership. Finally, the post looked at trust in the European Union over time. While distrust has not increased, ambivalence does seem to be spreading among Georgians, particularly in 2013. To further explore issues related to international organizations and the EU in Georgia, and the South Caucasus more generally, we recommend exploring our datasets here or using our Online Data Analysis Tool here. Readers may also be interested in the blog, Can’t get no satisfaction. Who doesn’t want to join the EU? published in March 2014 on the CRRC blog.


